Prise en main de Bokeh - Le guide ultime
Bokeh est un package Python qui permet de créer des visualisations de données interactives et des applications web.

Installation#
Bokeh peut-être installé depuis le gestionnaire de packages Pypi
Importation#
Afin d'utiliser Bokeh, vous devez l'importer comme ceci
Importation des données#
import pandas as pd

DATA_PATH = "dashboard/data/deputes-active.csv"

dataframe = pd.read_csv(DATA_PATH)
dataframe.head()
Bokeh implémente sa propre structure de données ColumnDataSource
# Import ColumnDataSource
from bokeh.models import ColumnDataSource

# Convert DataFrame into ColumnDataSource
source = ColumnDataSource(dataframe)
Visuel de données#
La création de visuel avec Bokeh se fait grâce à la fonction bokeh.plotting.figure
from bokeh.plotting import figure

fig = figure(plot_width=250, height=250, name="figure")

fig.show()
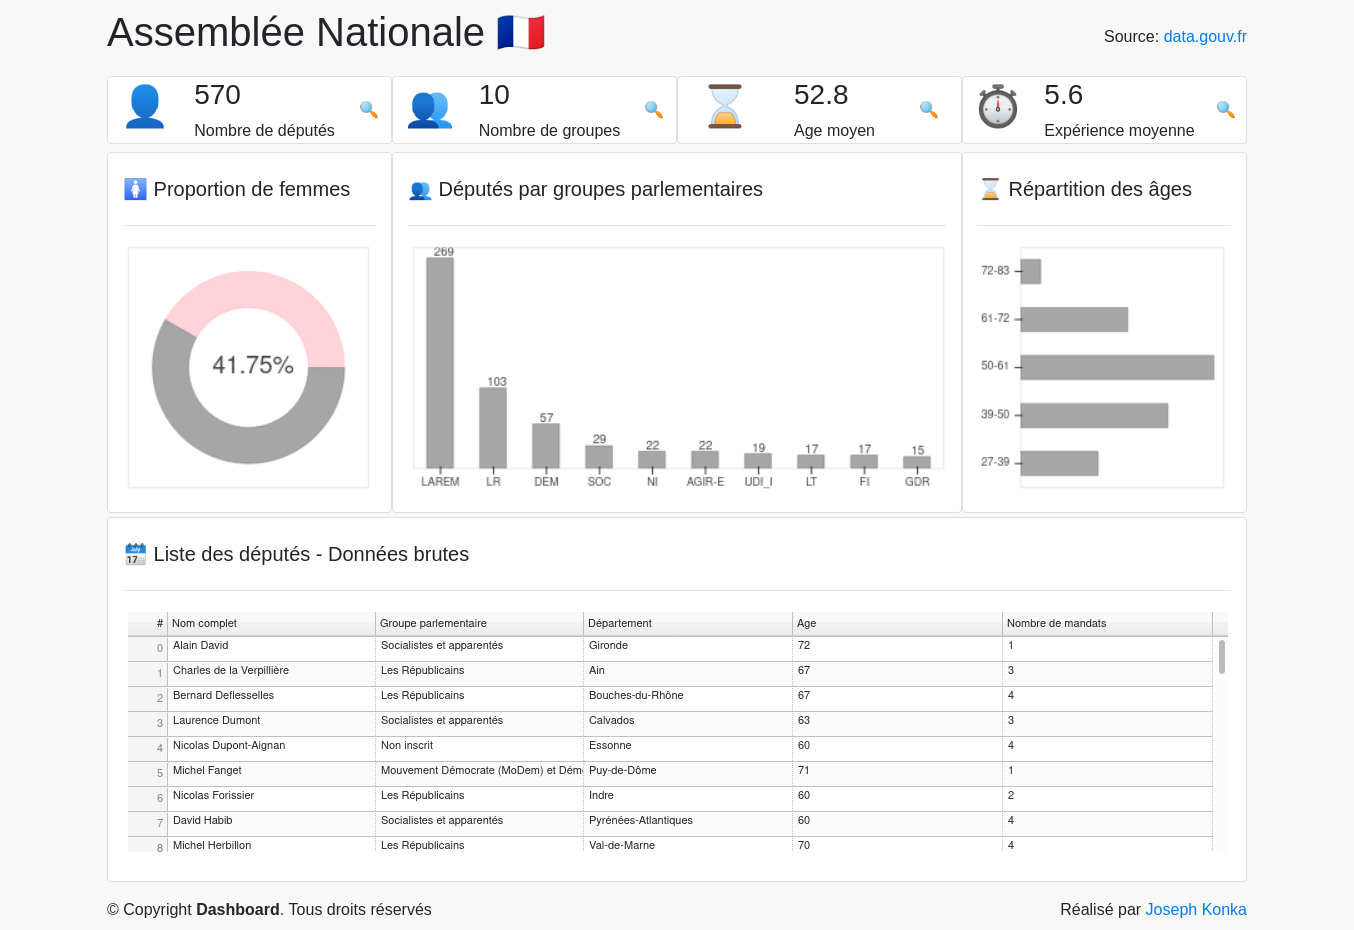
Diagramme en bâtons#
from bokeh.plotting import figure

bar = figure(plot_width=250, height=250, name="Vertical Barplot")

bar.vbar(x="groupeAbrev", top="size", width=.5, color='gray', alpha=0.7, source=source)

bar.show()
from bokeh.plotting import figure

bar = figure(plot_width=250, height=250, name="Horizontal Barplot")

bar.hbar(y="age", right="size", height=0.5, color='gray', alpha=0.7, source=source)

bar.show()
Biagramme en secteurs#
from bokeh.plotting import figure

pie = figure(plot_width=250, height=250, name=name)

pie.annular_wedge(x=0,
                      y=1,
                      inner_radius=0.5,
                      outer_radius=0.8,
                      start_angle=cumsum('angle',include_zero=True),
                      end_angle=cumsum('angle'),
                      color='color',
                      alpha=0.7,
                      source=source)

pie.show()
Courbes#
Table de données#
from bokeh.models import DataTable, TableColumn

columns = [
    TableColumn(field="nomComplet", title="Nom complet"),
    TableColumn(field="groupe", title="Groupe parlementaire"),
    TableColumn(field="departementNom", title="Département"),
    TableColumn(field="age", title="Age"),
    TableColumn(field="nombreMandats", title="Nombre de mandats"),
]
table = DataTable(source=source, columns=columns, height=240, width=1100, name=name)

table.show()